

Somewhere in your utility’s annual water quality report there is probably a line for PFAS, and next to it two letters: ND. Not detected. A study published on October 23 argues that when the country’s monitoring records are added up that way, the national picture lands at roughly half of what the same data supports.
That is a claim about arithmetic, not about anyone’s water getting worse. It is worth understanding anyway, because the same arithmetic sits behind the line on your own report.
What the study actually found
Gehendra Kharel, an associate professor at Texas Christian University, and colleagues reanalyzed the EPA’s national PFAS monitoring dataset as it stood in January 2026. The paper appeared in Cell Reports Sustainability on October 23, 2026.12
The dataset holds more than 1.8 million individual PFAS measurement records drawn from 9,991 community water systems. About 98 percent of those results came back below the laboratory’s reporting level.13
Standard practice is to treat a below-limit result as zero. The team instead estimated a value for each one, generating 500 estimates per record and averaging them. Counting those results as zero, they found, captures only about 44 percent of the modeled average across 25 PFAS. For the six PFAS the EPA regulates, the reported national average is roughly 2.6 nanograms per liter against a modeled 5.2.13
Kharel is careful about what this is: “a model-based estimate of PFAS occurrence, not a measurement.” It does not conclude that any supply is unsafe, it looked at water entering distribution systems rather than anyone’s tap, and it did not examine health effects.13
The number hiding behind “not detected”
A non-detect is not a reading of zero. It says the result fell below the lowest concentration the laboratory was required to report for that method. There is always a number attached, and the utility can give it to you.4
Under the EPA’s fifth Unregulated Contaminant Monitoring Rule, public water systems sampled for 29 PFAS plus lithium during a twelve-month window between January 2023 and December 2025. The minimum reporting level for both PFOA and PFOS was 0.004 micrograms per liter, which is 4 parts per trillion.4
That is the same number as the enforceable limit. The EPA’s 2024 PFAS rule set maximum contaminant levels of 4.0 parts per trillion for PFOA and for PFOS, with health goals of zero for both.5
So on that program, not detected means below 4 parts per trillion. It does not mean nothing is there, and it leaves no room underneath to tell 3.9 apart from 0.1. That space is what the study estimates.

What this does not mean
It does not mean your water changed. Nothing was added to any supply. What changed is the statistical treatment of existing records.13
It is also not a result for your kitchen tap. The monitoring program samples treated water entering the distribution system, and your service line and plumbing sit downstream of that point. A system-level report cannot answer a question about one address.48

The regulatory picture is moving too. On May 18, 2026 the EPA proposed keeping the PFOA and PFOS limits while letting systems request two further years, to 2031, and separately proposed rescinding the limits for PFHxS, PFNA, HFPO-DA and the hazard index for mixtures.5
What to ask, and where to look
Every community water system publishes an annual Consumer Confidence Report. It names the source, lists what was detected, and gives the benchmarks. It is free, and the utility is the right first call for anything you cannot read.6
Find your water quality report
For an answer about your own tap rather than the system average, use a laboratory certified by your state. Home strips and overall water scores do not substitute for it.7
Find a certified drinking-water lab
For area-level background, Epic’s What’s in Your Water lookup shows what has been reported near you. It is a starting point for questions, not a test of your tap.
What a filter can and cannot do here
A pitcher filter does not change what your utility reports, and it cannot tell you what was in the water beforehand. It treats the water you pour through it, a narrower job than the one this study describes.
The same detection-floor logic applies to filter testing. Independent reduction tests report an effluent result as below the laboratory’s detection limit rather than as zero, and the percentage any test can demonstrate is capped by how much of that chemical was in the challenge water. A lightly spiked chemical can show a lower headline percentage than a heavily spiked one while both finished below the same floor. Read the method and the challenge concentration, not just the chart.
Certification and reduction testing are two different things. Pure XP and Nano XP are listed by NSF under Standard 42 for material safety and NSF/ANSI/CAN 372 for lead content.910 Reduction performance, including PFOA and PFOS under the NSF P473 protocol, is documented separately in independent testing.11
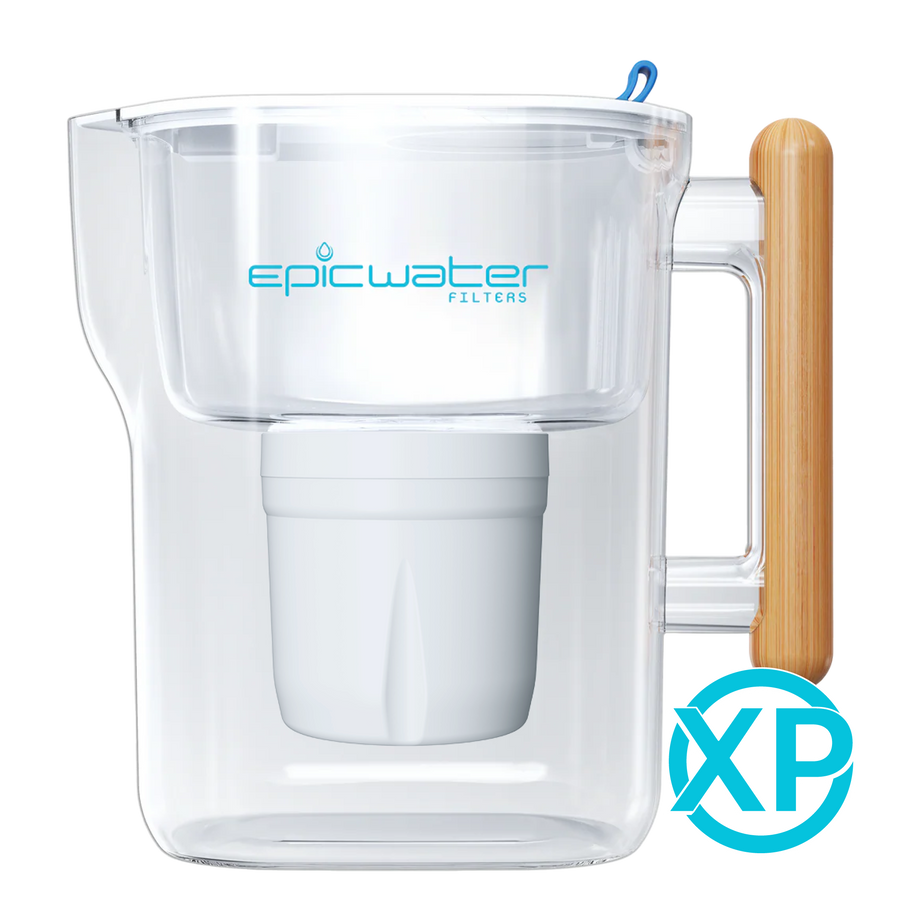
If a pitcher or dispenser fits what your report shows, explore Epic’s pitchers, dispensers and bundles. Start from the contaminant, then check the documentation for that filter.
Questions about non-detects and reporting limits
What does ND or “not detected” mean on a water quality report?
It means the laboratory did not report a detection at or above the reporting limit for that method. It is not a measurement of zero. Ask your utility what reporting limit applied, because that number is the real floor of the result.
Does this study mean my tap water has more PFAS than my utility said?
Not as a finding about your tap. The researchers modeled national occurrence from existing records, and described the result as an estimate rather than a measurement. It does not say whether any supply is safe or unsafe.
What should I ask my utility?
Which chemicals were tested, what reporting limit the laboratory used for each, and how often results fell below those limits. Those three answers turn an ND into something you can interpret.
Does a pitcher filter remove PFAS?
Epic’s filters are independently tested for PFOA and PFOS reduction under the NSF P473 protocol. That is separate from the NSF certifications, which cover material safety under Standard 42 and lead content under NSF/ANSI/CAN 372. Check the data sheet for your exact filter.
Is “below the detection limit” the same as zero on a filter’s test report?
No, and for the same reason it is not on a utility report. It means the result fell below what the method could report. The percentage reduction a test can show is also limited by how much of the chemical went into the challenge water.
Sources & references
Reviewed November 4, 2026
- Texas Christian University / EurekAlert release on the Kharel study ↗The 44 percent figure, 9,991 community water systems, and the 2.6 against 5.2 nanograms per liter comparison.
- Kharel et al. / Cell Reports Sustainability, October 23, 2026 ↗“Censoring-Aware Models Quantify Systematic Underestimation of PFAS Occurrence in U.S. Drinking-Water Monitoring”.
- Circle of Blue / Inside Climate News coverage of the study ↗Independent reporting on the method, the 98 percent below-limit share, and the researchers’ caveats.
- EPA / Fifth Unregulated Contaminant Monitoring Rule ↗29 PFAS plus lithium, Methods 533 and 537.1, monitoring window, and the 0.004 micrograms per liter reporting level.
- EPA / PFAS National Primary Drinking Water Regulation ↗The 4.0 parts per trillion limits, the zero health goals, and the May 18, 2026 proposals.
- EPA / Consumer Confidence Reports ↗How to find your water system’s annual water quality report.
- EPA / Certified drinking-water laboratories ↗State certification programs and laboratory contact information.
- EPA / Home Water Testing Facts (PDF) ↗Why a system-level report cannot answer a question about one household’s plumbing.
- NSF / Official Standard 42 component listing ↗Certification for material safety requirements only.
- NSF / Official NSF/ANSI/CAN 372 listing ↗Lead-content certification of the listed filter components.
- Epic Water Filters / Testing documents ↗Independent performance reports, data sheets and certification resources.
Reporting limits and methods vary by program and contaminant. Figures here describe national monitoring data and federal standards, not any particular address. The desk and river photographs are generated editorial illustrations. The Pure XP image is an official product photograph.
Condividi:
Road Salt Season Is Starting. What It Does to Your Tap Water.
Do Plastic Water Pipes Release Microplastics? A New Study Counted Them