
A report published on October 6 put a number on something households have felt for years without being able to measure it. Water from the tap, the cheapest thing in most kitchens, is getting more expensive faster than almost everything else in the budget.
A rising price is a good reason to understand what you are buying. A water bill pays for a narrow set of things and stops at a physical boundary most people have never been shown. Knowing where that line falls tells you whether a problem at your tap is your utility’s, yours, or nobody’s.
What the new numbers say
Food and Water Watch, a national advocacy group, analyzed drinking water prices at the 500 largest community water systems, which together serve more than 155 million people, roughly 45 percent of the country. Between 2015 and 2025 the average household water price across them rose 62 percent, from about $336 a year to about $531.12
Set against other household costs, that is steep: 1.6 times the overall rate of inflation over the decade, about twice the rise in grocery prices, and 19 percent faster than median household income grew.2
The burden is not spread evenly. Coverage of the report noted West Virginia households facing the highest average bills, around $1,383 a year, and systems run by for-profit utilities charging 67 percent more on average than publicly run ones. The report also found 93 percent of the systems it examined charging rates unaffordable for low-income households.23
Most of that money is in the ground
Treatment is the part of a water system people picture, and it is the smaller part of the cost. EPA’s seventh national assessment of drinking water infrastructure put the twenty year need at $625 billion. Distribution and transmission, which is to say pipes, account for $420.8 billion of that, treatment for $106.4 billion and storage for $55.3 billion.4
That total ran 32 percent above the previous survey, and it describes work nobody sees. Mains laid in the middle of the last century are reaching the end of their service lives together, and replacing a mile of pipe costs the same whether anyone notices or not.4

What the bill does not cover
A water bill buys water treated to meet the National Primary Drinking Water Regulations, the set of contaminants carrying legally enforceable limits. It does not buy water treated to the secondary standards, which cover appearance, taste and odor and are non-enforceable guidelines.6
That distinction explains a great many kitchen complaints. Chlorine taste, a metallic edge, cloudiness and seasonal earthiness are mostly secondary issues, so a utility can meet every enforceable limit and still deliver water you would rather not drink. When something goes wrong on the enforceable side you get a notice, and the tier printed on it says how urgently to act.
The bill also stops at a physical boundary. The service line is the section of pipe connecting your home to the water main, and in many systems ownership of it is split between the utility and the owner.8 Everything past that point, the pipes and fixtures inside your walls, is yours. Lead and copper are frequently a plumbing question rather than a treatment question, which is why it is worth knowing what your own service line is made of.
One thing you have already paid for is the annual water quality report your utility must publish, listing what was detected, at what level, against the limit.7 A violation notice is a separate document with its own timing rules, and those rules are why one can arrive months late.
Find your annual water quality report ↗
For area-level background, Epic’s What’s in Your Water lookup shows what has been reported near you. It is not a test of your own tap.

Do the arithmetic before you buy anything
The reflex when a bill jumps is often to buy bottled water, the most expensive water in the house by a wide margin. Work out its shelf price per gallon first: a case of twenty four half liter bottles holds about 3.2 gallons. A filter does not lower your water bill either. It is a second purchase on top of the first, changing the water at one tap rather than what reaches your meter.
The arithmetic for a pitcher is at least simple. A Pure XP cartridge is rated for 150 gallons. At the replacement prices listed on Epic’s site in October 2026, $54 for a cartridge, $59 for the cased filter and $145 for a three pack, that is roughly 32 to 39 cents per gallon of filtered drinking water.
What a filter is certified for and what it is tested for are two different statements, and the difference matters when you compare prices. Pure XP is listed by NSF under Standard 42 for material safety and under NSF/ANSI/CAN 372 for lead content.910 Its contaminant reduction figures are independent test results, not NSF certifications: 99.9 percent of lead under the NSF/ANSI 53 protocol, PFOA and PFOS under the NSF P473 protocol, and over 99.9 percent of microplastics.11
What it will not do matters just as much. It does not change what arrives at your meter, replace a service line, reduce your bill, or substitute for following a boil water advisory. A cartridge used past its rated volume stops performing as tested, so the replacement cadence is part of the cost.
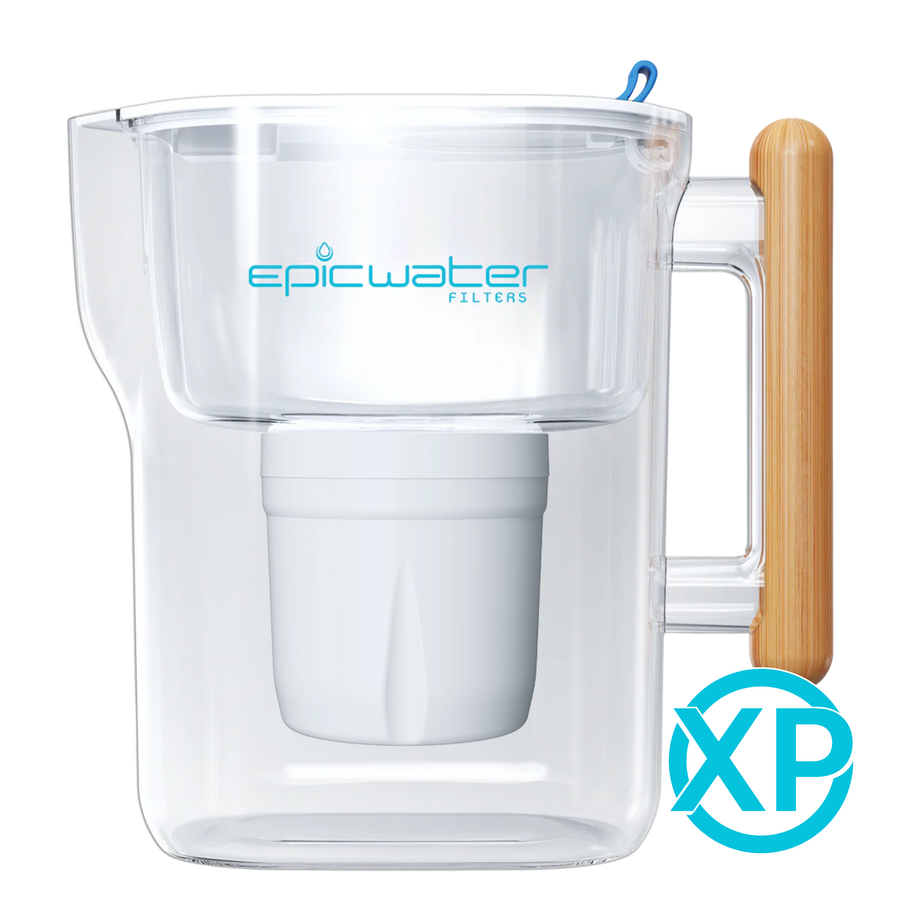
If a pitcher or dispenser fits how your household drinks water, explore Epic’s pitchers, dispensers and bundles.
Questions about rising water bills
Why did my water bill go up so much?
Nationally, prices at the 500 largest systems rose 62 percent between 2015 and 2025, faster than inflation, groceries or incomes. The report names aging infrastructure, treatment costs and federal investment. Your own increase also reflects local rate and debt decisions.
Is bottled water cheaper than filtered tap water?
Almost never, but check rather than assume. Work out the shelf price per gallon of the case you buy and compare it with a cartridge price divided by its rated volume. Tap sits well below both.
Does a water filter reduce my water bill?
No. A filter treats water at one tap and has no effect on the volume you use or the rate your utility charges. Anyone telling you otherwise is selling something.
Who pays to replace the pipe between my house and the street?
It depends on your utility. The service line connects your home to the main, and ownership is often split between the utility and the property owner. Ask your utility where their responsibility ends, and ask whether a replacement program covers the customer side.
Where can I see what is actually in my water?
Start with the annual water quality report your utility must publish, which lists detections against limits for the previous year. For anything specific to your own plumbing, only a state-certified laboratory result will answer it.
Sources & references
Reviewed October 7, 2026
-
Food & Water Watch / Surging Water Costs amid the US Affordability Crisis (October 6, 2026) ↗The primary report: 500 largest community water systems, 2015 to 2025 price change, affordability findings.
-
Inside Climate News / Water bills surged more than other costs in US homes over 10 years (October 6, 2026) ↗Independent reporting on the report: 62 percent, $336 to $531, inflation and income comparisons.
-
Gizmodo / US water bills surged 62% in 10 years (October 6, 2026) ↗Second independent account: state-level averages and the public versus for-profit comparison.
-
EPA / 7th Drinking Water Infrastructure Needs Survey and Assessment, public factsheet (PDF) ↗The $625 billion twenty year need and its split across distribution, treatment and storage.
-
EPA WaterSense / How we use water ↗The average American family uses more than 300 gallons of water per day at home.
-
EPA / Drinking water regulations and contaminants ↗Primary regulations are legally enforceable; secondary standards are non-enforceable guidelines.
-
EPA / Consumer Confidence Report information for consumers ↗The annual water quality report your utility must provide, and how to find yours.
-
EPA / Protect Your Tap: a quick check for lead ↗What a service line is and why the pipe connecting a home to the main matters.
-
NSF / Official Standard 42 component listing ↗Pure XP listing for material safety requirements only.
-
NSF / Official Standard 372 listing ↗Lead-content certification of the listed filter components.
-
Epic Water Filters / Testing documents ↗Independent performance reports, data sheets and certification resources.
The half cent per gallon figure is a calculation from sources 1 and 5, not a reported statistic; your own rate and use will differ. Replacement filter prices are Epic list prices read on October 7, 2026 and will change. NSF listings for Pure XP cover material safety under Standard 42 and lead content under NSF/ANSI/CAN 372; contaminant reduction figures are independent test results, not NSF certifications. The street trench and pantry photographs are generated editorial illustrations. The Pure XP image is an official product photograph.
Aktie:
Is Softened Water Safe to Drink? And Do You Still Need a Filter?